
Gold
per troy ounce
$3,898.90▼ 7.22%

A new perspective on global trading. Research-led strategy. Transparent financial practice. Built for a more open financial future.
About COSY Capital
COSY Capital is a premier trading house. We deploy expert market strategies to trade your capital and share the profits directly with you. High performance, total transparency.
A snapshot of the assets and macro indicators shaping COSY Capital’s research and strategy.
CoinGecko total capitalisation · 24h
Model estimate · 2022 BIS baseline scaled by FX price changes
Model estimate · fixed quantities × Yahoo futures prices
Every deposit is designed to show its own evidence — on-chain and on paper — so you can see exactly how your capital is handled at each step.
Figures reflect historical performance. Results vary with market conditions.
Every deposit is confirmed directly against the blockchain — the transaction, the contract, the amount and the confirmations — so it is credited on evidence you can see for yourself.
Every deposit carries a trackable reference and a money receipt, so you can follow its status from the moment it is sent through to confirmation.
A structured research and risk-management process guides how capital is allocated, so every position follows the same considered method.
Our process, records and company details are open to review, and we welcome you to verify independently whatever matters to your decision.
Market information is organized into structured context before capital moves.
COSY Capital’s research and strategy span traditional and digital markets alike — each approached with the same disciplined, risk-aware process.

A traditional store of value, traded through global spot markets and held as a hedge against inflation and volatility.
Start Trading Now →
Digital assets settled on-chain, researched and allocated with the same discipline applied to any traditional market.
Start Trading Now →
A dual-purpose metal bridging industrial demand and monetary hedging, tracked across major commodity exchanges.
Start Trading Now →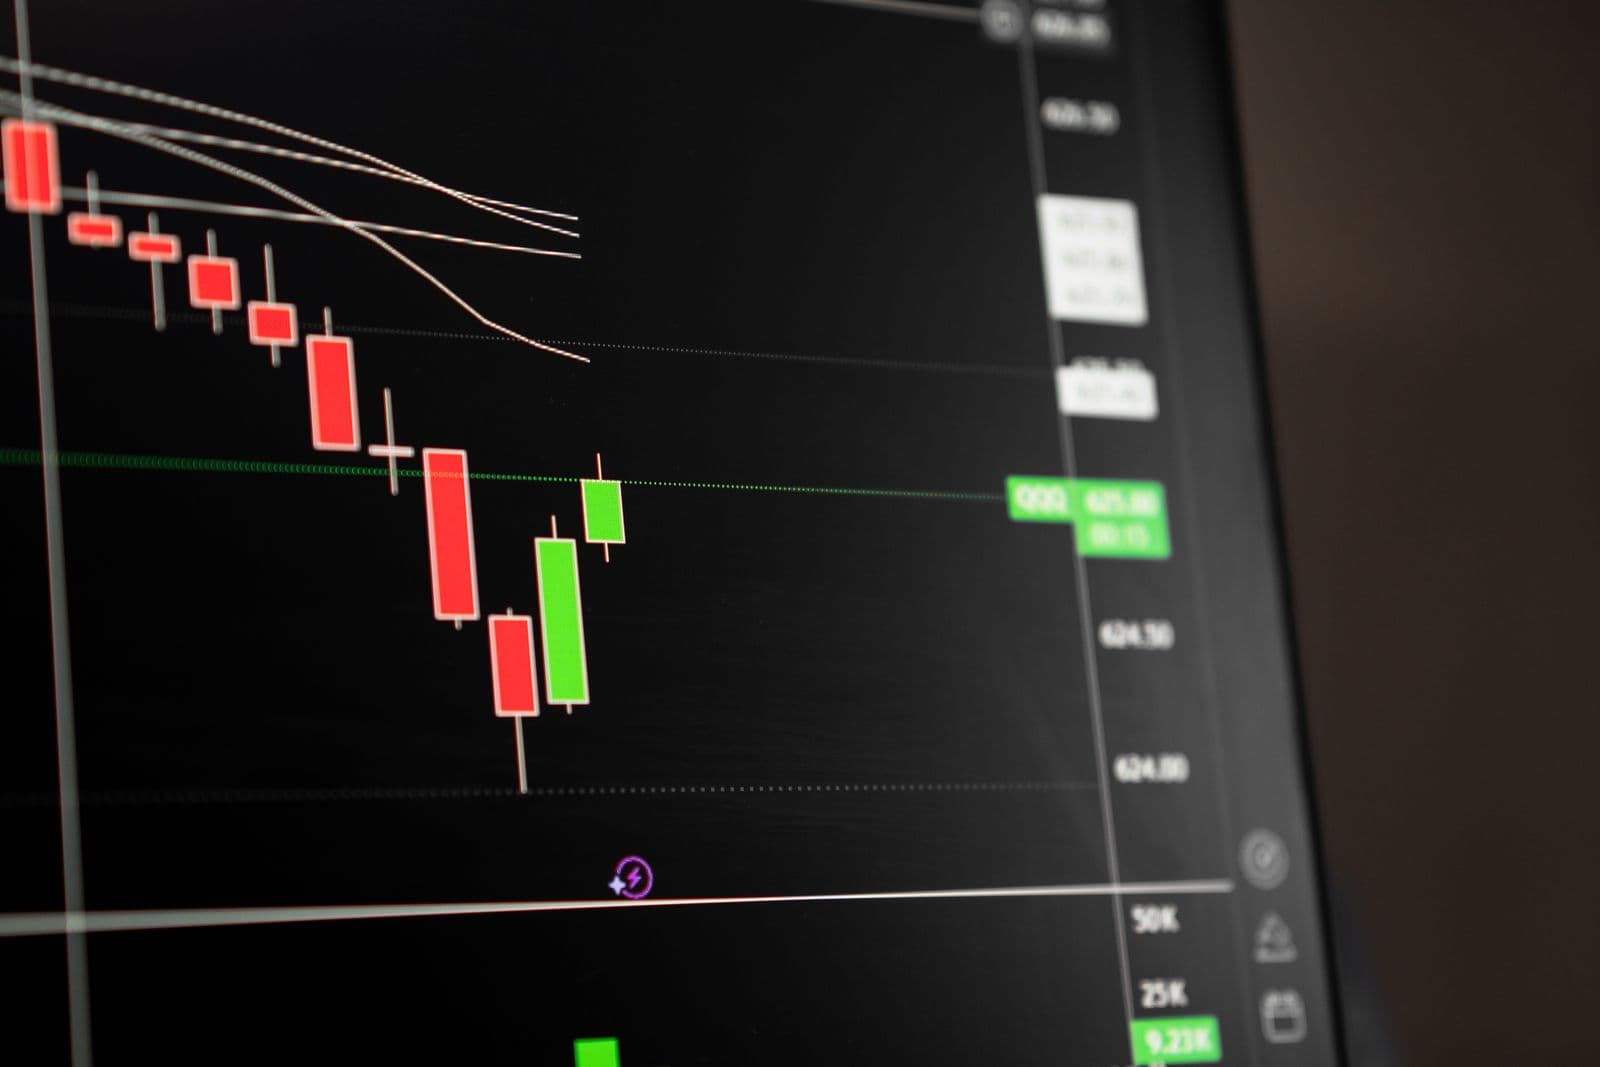
The largest and most liquid market in the world, where macro research meets disciplined, round-the-clock risk management.
Start Trading Now →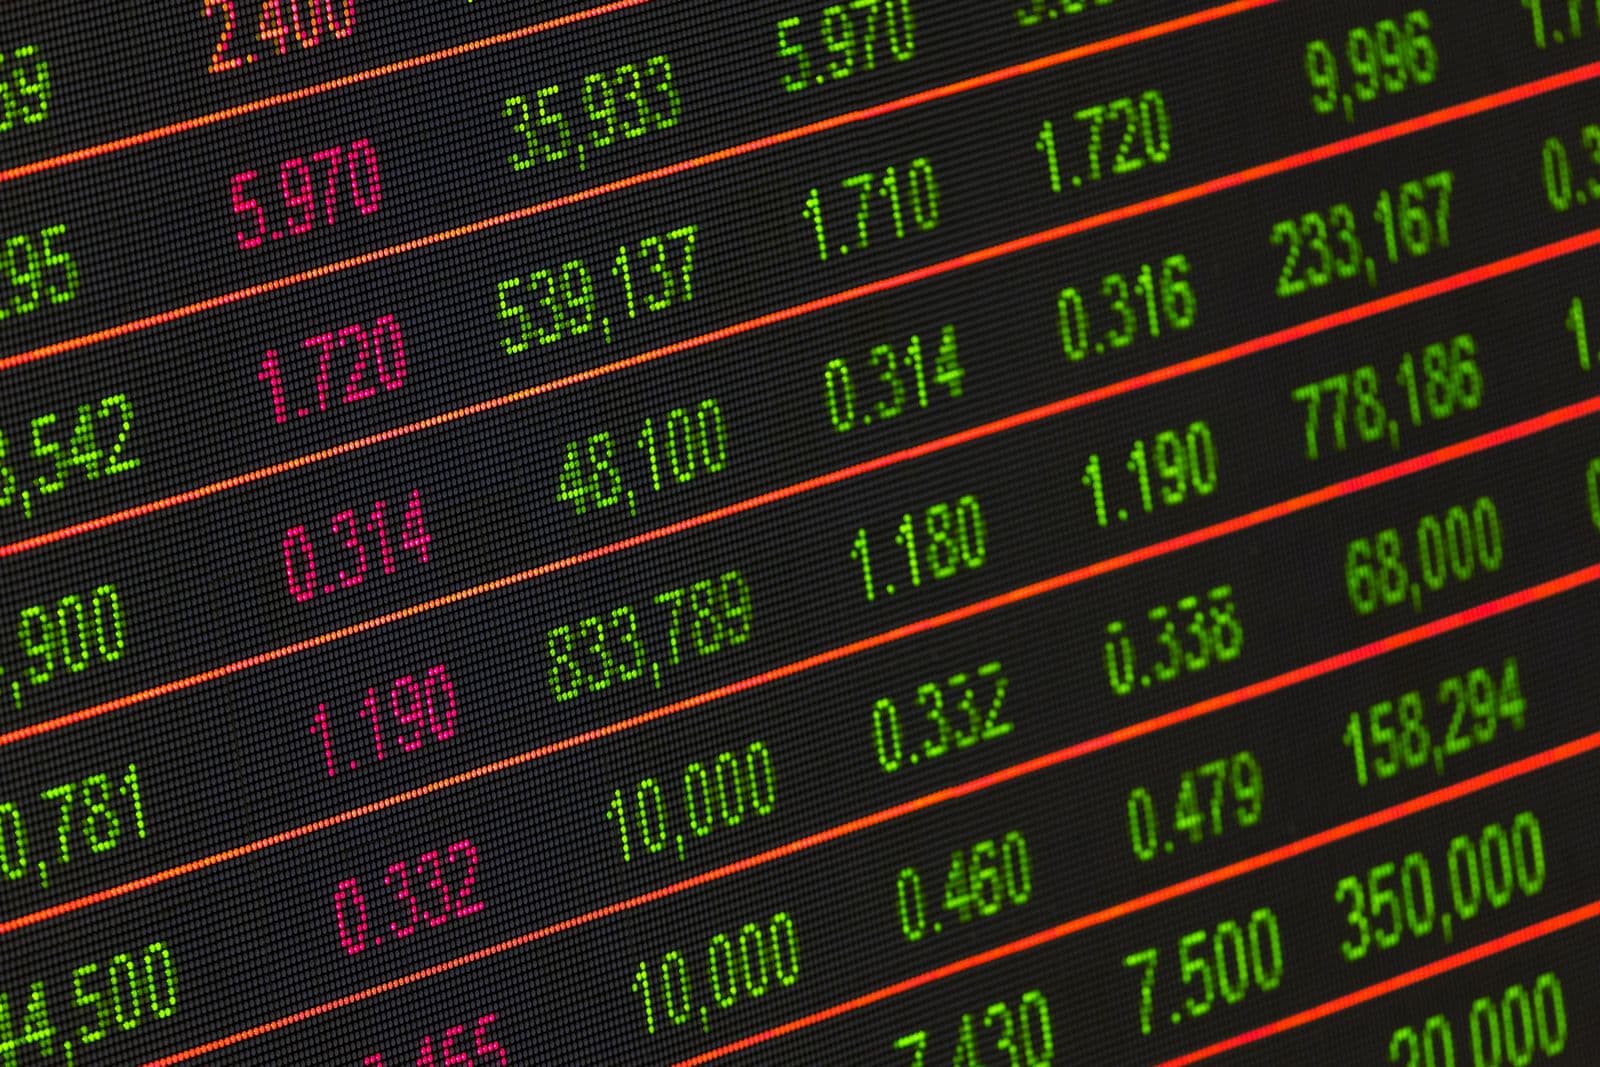
Equity positions built on fundamental and technical research across established, publicly listed markets.
Start Trading Now →Precious and industrial metals tracked across global spot and futures markets — the traditional store-of-value leg of the research process.
Crude benchmarks and natural gas — the macro inputs that move inflation expectations and, with them, nearly every other market on this page.
The deepest, most liquid markets in the world alongside the equity benchmarks they price — where macro research meets round-the-clock risk management.
Flexible allocation lets you participate in the COSY Capital ecosystem while assets remain dedicated to long-term, professionally managed growth.
Maximize Your Returns: Explore Indicative Payouts Across Our Flexible Deposit Plans
The same deposit, paid out on different schedules — see how frequency shapes what you receive over time.
| Plan | Rate | Profit |
|---|---|---|
| Weekly | 1.75%–2.10% | $175–$210 |
| Monthly | 9.00%–12.00% | $900–$1,200 |
| Quarterly | 12.00%–15.00% | $3,600–$4,500 |
| Half-yearly | 15.00%–20.00% | $9,000–$12,000 |
| 2x Program | $20,000.06 | $10,000.06 |
Profit is per payout on a $10,000 deposit; for the 2x Program it is the total over the term. Monthly, quarterly and half-yearly rates are per month — a quarterly payout pays 3 months, a half-yearly payout 6. Figures are illustrative.